Measurements of Flash Duration of the Pentax AF-540FGZ Flash - and the Neewer SF-01 Slave Flash
David B. Shaffer Ph.D.
There does not seem to be any comprehensive study or presentation of the flash duration times for the Pentax AF-540FGZ flash on the web (or elsewhere). (I will refer to the flash as the 540 hereafter). Several members of the Pentax forums have inquired about the flash duration of the 540.
I was curious, as well, as I want to use this (or some other flash) for taking pictures of water drop collisions. See http://www.diyphotography.net/the-comprehensive-water-drop-photography-guide and http://www.liquiddropart.com for some fantastic shots of what I hope to achieve - someday! These web sites were the initial impetus to learn water drop photography. I will post in other URLs what I have learned, along with some hardware which would help anybody achieve such results.
Here I report direct measurements of the flash duration for the 540 for all power levels. The flash can be set to give “full” power flashes and flashes of 1/2, 1/4, 1/8, 1/16, 1/32, and 1/64 power. I also include results for the Neewer SF-01 slave flash which is available on Ebay for an incredible price (~$10 - $12!).
If you have comments on these data, or would like to discuss having me make some similar measurements on your flash, please email me at
dave(at)photodave.us (replace the obvious substitution! An attempt to keep spam email harvesters away!)
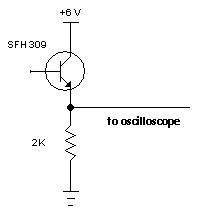
I made my measurements with a fast-response phototransistor, the Siemens SFH-309. (The specifications document for the SFH-309 says the rise/fall time is around 5 to 8 microseconds, depending on the version. I am not sure exactly which version of the phototransistor I have.) The photocurrent resulting from the flash's light falling on the phototransistor was sampled, displayed, and recorded with my Owon DS6062 digital storage oscilloscope. This 'scope is rated to 60 MHz, so its response time should be 10 nanoseconds or better. That is short enough so that the data sampling will not affect flash duration measurements at all.
I connected the phototransistor to a 6V battery power supply and measured the voltage variations across a 2Kohm resistor when the flash was fired (my circuit is shown in the figure on the left). I was careful to attenuate the flash light by distance and with optical absorbers so that the photo voltage remained below the supply voltage. (One of my data images shows what happens when you don't do this.) This required reducing the light input to the phototransistor by as much as a factor of a thousand or more, so there was plenty of light from the flash for good measurements.
The DS6062 was set up to sample 100,000 voltage values during a flash pulse measurement. Care was taken to ensure that the beginning of the data record was well before the flash fired, and that the flash light had fallen back to the quiescent (no light) level by the end of the data record.
For my analysis, I have determined the standard flash duration values of t-0.1 and t-0.5. T-0.1 is defined as the time between the 10% levels of the peak light from the flash, from the rise (light turning ON) to fall (light turning OFF). T-0.5 is the time between the 50% levels of the light. T-0.5 is often given by flash manufacturers for the duration of their flash, I think because it makes their flash times seem nice and short! However, a fair amount of light is emitted before and after the 50% levels. I think the t-0.1 value is a better indication of the flash duration and how it will affect stop-motion photographs.
However, I think there is an even better measure of the flash duration: how long it takes for some fraction of the total light of a flash discharge to be emitted. Therefore, I have also determined what I call P50 and P90 for all my data. I define P50 as the time during which 50% (half of the total light output of a flash discharge) of the flash light is emitted. Similarly, P90 is the time during which 90% of the total flash output takes place. If you want to stop action with your flash (such as for water drops), then I think the P90 (or some other "P" which you might deem to be better!) value is the best indicator of whether or not you will see almost stationary images during a flash. Some flash guns have very long tails in their light distribution, especially at maximum power. Your camera will be responding to this light if you have opened the shutter for a long exposure and are counting on the flash duration to provide the effective length of your exposure.
To anaylzye the flash data, I wrote a FORTRAN program which runs on my PC.
First, I averaged the 100,000 points from an Owon data file into 4000 values (i.e. I took a straight average of every 25 points). This averaging reduces the sampling noise, but does not appreciably smooth the data so that no timing information is lost. I then removed any slope to the data by subtracting a simple straight line that was fit to the first and last 50 data points, when the light level should be zero. I then normalized the data to the maximum light value (i.e. divided every data point by the peak value found within the entire data span). Then, near the 10% and 50% amplitude levels (of flash brightening and decreasing), I determined, with a quadratic fit to the nearby light amplitude data, exactly the time when the 10% and 50% levels occurred.
I also integrated (summed up) the light curve, by simply summing the light output values (and normalizing by the total sum of the amplitude data) so that I could determine the times when 5% and 95% of the total flash light power had occurred, as well as the times for 25% and 75% integrated power levels of light emission.
The differences between the relevant times give me the t-0.1, t-0.5, P90, and P50 values. The several microseconds rise/fall time of my photo detector will affect these times very slightly. I did not do any extended analysis, but if the light curves were Gaussian (they are not, but their characteristics are not very different in the vicinity of the measured times), the smoothing effect of the detector would cause the measured times to be: Tmeasured = sqrt(Tactual^2 + Trise/fall^2), where "sqrt" is square root, "^2" means to square the value, and Trise/fall is the response time of the phototransistor. For the shortest times I measured (around 30-40 microseconds, except for the rise time of the Neewer flash), any smoothing effect like this is less than 1 microsecond.
Starting on the next page, I describe the light curves and show my results for all the 540 flash power levels, and for the Neewer SF-01 flash.