Flash Duration Results for the Pentax AF-540FGZ Flash - and the Neewer SF-01 Slave Flash
Results for Full and 1/2 Power, and Superposed Light Curves For (almost) All Levels
David B. Shaffer Ph.D.
Here and on the next few pages I show the results for the 540 flash. For all of the flash curves, the T-0.1, t-0.5, P50, and P90 levels are given. All flash light curves were measured at least twice, and the consistency is at the 1-2 microsecond level from flash to flash, except for the much longer, full-power flash. If you haven't already, before you read on, take a look here for a description of the oscilloscope traces for the various flash intensity screen dumps.
At the start of these measurements, freshly-charged NiMH batteries were installed in the flash, and the flash was put in manual mode ("M", selected by the mode push button on the back of the flash), so that the flash power could be set to the various power levels. Typically, a flash discharge or two were required to get the scope amplitude and time scale set properly, so that the phototransistor detector was not saturated and the full duration of the light curve was recorded, with adequate pre- and post-flash data to establish the zero level.
My light curves are remarkably similar to these measurements of a Canon Speedlight, as reported by Jeremy Stein and Toomas Taam. I suggest following the links within that reference to learn more about electronic flashes.
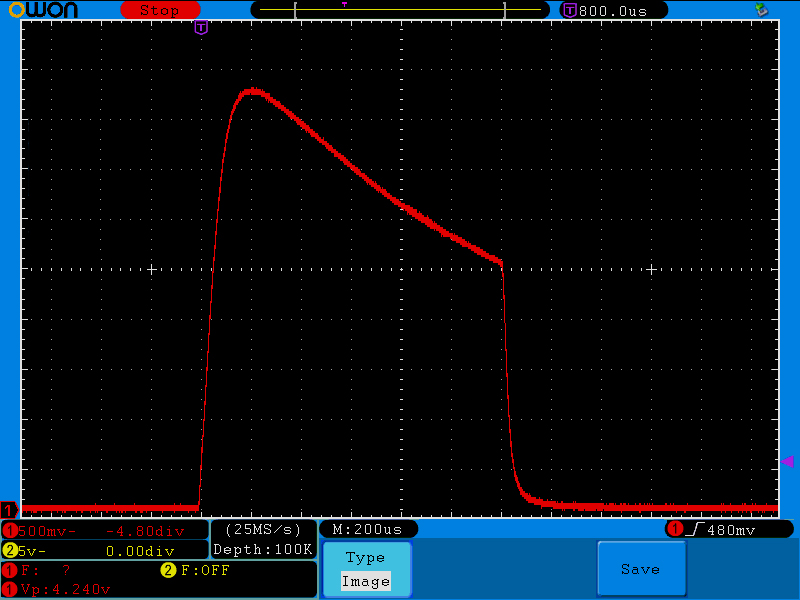
Full Power: we see a rapid rise to maximum brightness, followed by a lengthy tail-off of the light. The "t" and "P" values are given below. These are the average for three flash events. The time constant for the rise in light is around 70-80 microseconds and the time constant for the light fall off is around 2.1 milliseconds (where the "time constant" is the value of tau which roughly matches the following equations: for light rise time: Brightness = 1 - exp(t/tau) where t is the time since the flash turns on (with some allowance for a bit of delay in the turn on, and Brightness = exp(-t/tau) for the fall in light intensity after the flash reached peak intensity - again, with some allowance for when the exponential fall-off begins).
For full power: t-0.5 1570 microseconds or 1/637 seconds
t-0.1 4965 microseconds or 1 /201 seconds
P50 1900 microseconds or 1/526 seconds
P90 4110 microseconds or 1/243 seconds
I also give the 1/xxx values (to 2 or 3 significant digits), since many folks seem to like these values this way! Note that t-0.1 here is more than three times longer than t-0.5 (and P90 is more than two times longer than p50)!
The values for the three flash events which I measured differ more from each other than for any other power levels. The time consistency is more like 10 to 20 microseconds here - still a fairly small percentage error.
Half power: the rise is the same as for full power, but after a little more than 1 millisecond the flash is quenched (i.e. turned off) by some device within the flash which causes the light output to drop abruptly part way through the discharge curve seen for full power operation. This characteristic occurs at all power levels less than full - the flash output rises rapidly, but the light is turned off quickly as well, to limit how much total light is output by the flash. The figure at the bottom of this page shows light curves for all power levels from half to 1/64 superposed in one frame. Basically, for powers less than full, the flash sets the power level by terminating the flash early.
For half power: t-0.5 1170 microseconds or 1/855 seconds
t-0.1 1250 microseconds or 1/800 seconds
P50 575 microseconds or 1/1740 seconds
P90 1065 microseconds or 1/939 seconds
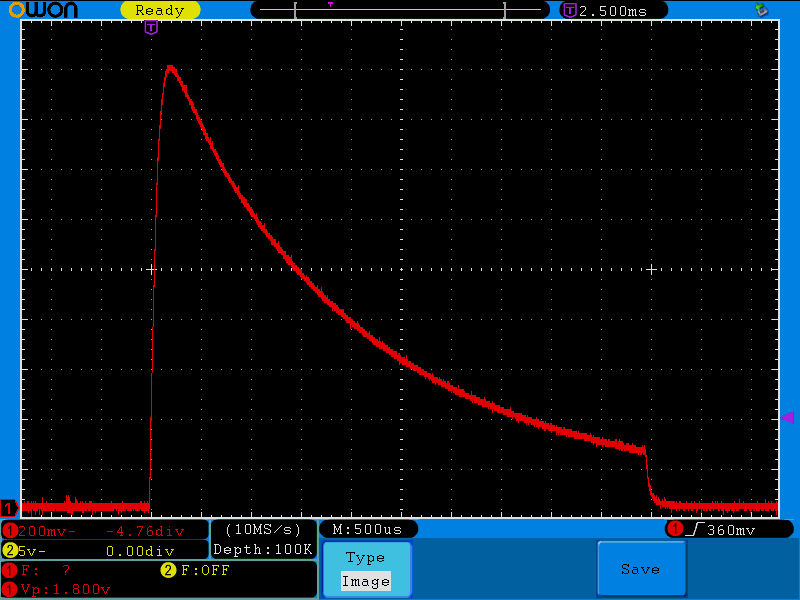
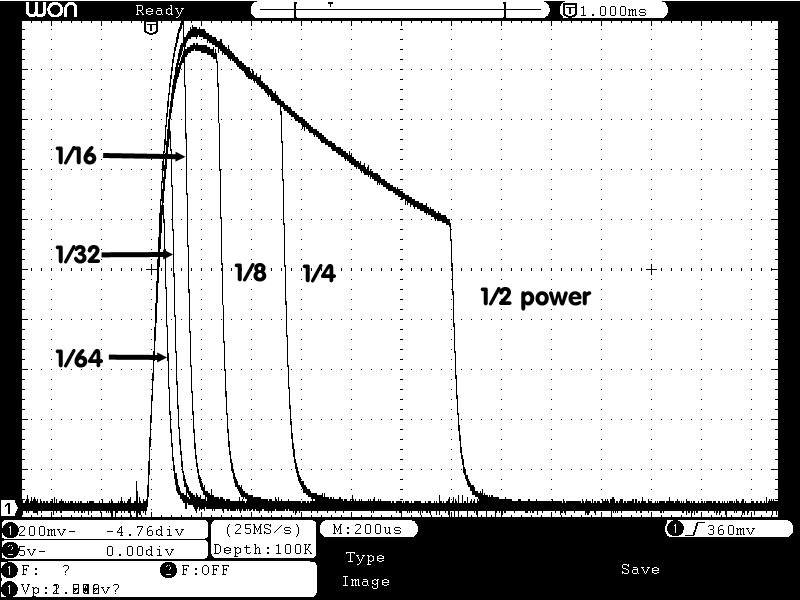
Below, I show light curves for all power levels (except full power) superimposed (I combined the screen dumps using Photoshop Elements). The full power curve is much longer than any of these flash durations, and including it would have compressed the time (horizontal) scale too much to see anything informative about the lower power data. A look at the two curves above gives a good comparison between the full and half power discharge behavior.
For these data, I attempted to keep the flash-detector distance and light absorption constant, so that the intrinsic light output of the flash is all that changed from curve to curve, unlike the other images here, where the time base and the light curve peak were optimized for each power setting.
The peak values do, indeed, seem to be about the same for the 1/2, 1/4, 1/8, and 1/16 curves. The peak values for the two lowest power settings (1/32 and 1/64) are substantially lower than the highest possible peak flash output.
For light curves for the lower power levels of the 540 flash, keep going.
Click within an image for a full-scale screen dump image