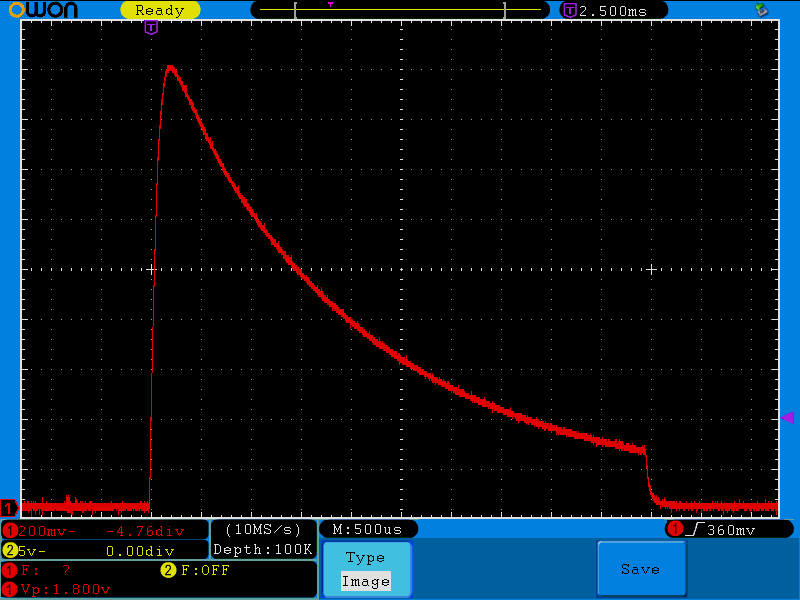
In the lower left corner of the image, the scope time and voltage per division can be seen: for the red trace (the #1 trace, noted by the red circles with the 1 in them) the voltage sensitivity is 200 mv per division, with the zero voltage point offset by -4.76 divisions. Also in red can be seen an F, which would be the frequency of a repetitive signal, and Vp, which is the peak-to-peak voltage - here estimated to be 1.800 V. (This value includes any noise on the data, so it tends to be a bit bigger than the real value. For my setup, this value should be less than about 5 volts, to avoid detector saturation). The yellow indicators refer to a second channel, which is not on for these measurements.
The white values indicate the sample rate (10MS/s = 10 megasamples per second, or one data point every 0.1 microsecond, or 100 nanoseconds), the "Depth" (total number of samples across the scan) which is 100K (100,000) here. Given the sample rate and depth, we can tell that the length of the data record corresponding to this image would be 10 milliseconds. The time span actually displayed is 15 divisions times 500 microseconds per division (the white "M:500us" indicator), or only 7.5 milliseconds. Thus, there is some guard data which are recorded but not displayed.
Now, let's look at some results!
Description of Flash Light Curves Recorded by SDS 6062 Digital Sampling Oscilloscope
David B. Shaffer Ph.D.
The flash light curve images that I show in this report are BMP "screen dumps" from the Owon SDS6062 oscilloscope. The screen dumps were recorded to a USB flash drive plugged into the scope. Also recorded on the flash drive were the data records (100,000 voltage value points per scan). The BMP images were converted to smaller but still quite high quality jpeg files in Photoshop Elements 9 for web display here. The data recordeds were converted from Owon's format to ASCII text files with a program that came with the scope. I then read the ASCII data into my PC for the FORTRAN analysis described elsewhere.
On the next few pages I show the results for the 540 flash and the Neewer SF-01 flash.
Here is a description of the light curve screen dump images. These images are a duplicate of the display on the Owon SDS6062 at the time each light curve was measured. The 'scope image are somewhat different than usually seen on an analog oscilloscope. Most particularly, the zero time point is not usually at the left of the screen. Unless a time offset has been dialed in, the zero point for these scope traces is the CENTER of the screen. (Since the voltages are first sampled, and then displayed, they can be put just about anywhere on the screen - even after a scan has been recorded. This takes a bit of getting used to if you've used an analog scope all your life!) All the data taken here have a time offset in them.
The number in white at the top right is the time offset from zero for the data point which is at the center of the screen image. The zero point is to the left of screen center for positive values: for the image below, the zero time corresponds to the beginning of the rise time of the flash pulse. In fact, the exact time refers to the trigger level, which can be seen (in the lower right; above the "Save" button) to be set for 360 mV on a rising pulse.